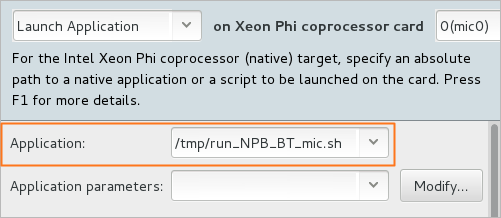
Use this analysis target configuration for a native application or a script running on the Intel Xeon Phi coprocessor. This target type is available for the Intel® VTune™ Amplifier XE only.
To access the configuration, open the Analysis Target window, choose the Intel Xeon Phi coprocessor (native) target system on the left, select the Launch Application target type from the drop-down menu on the right, and in the on coprocessor card field specify the required card number. You may specify one card only. By default, card 0 is used.
Note
Make sure to prepare your coprocessor system for analysis:
-
Install the sampling server and driver on an Intel Xeon Phi coprocessor card to be sampled.
-
For native application analysis, copy the binary to the Intel Xeon Phi coprocessor. For offload applications, no copying is required.
-
To communicate with the Intel Xeon Phi coprocessor cards, you may use any of the following mechanisms:
-
Mount an NFS share. See the NFS Mounting a Host Export topic in the Intel Manycore Platform Software Stack (MPSS) help for details.
-
Use existing SSH tools. Make sure to configure SSH to work in a password-less mode.
-
Basic Options
|
Use This |
To Do This |
|---|---|
|
Application field |
Specify an absolute path on the card for a native Intel Xeon Phi coprocessor application or a script. |
|
Application parameters field |
Specify input parameters for your application. Click the Modify button to choose a file or a folder as an input. |
|
Managed code profiling mode menu |
Select a profiling mode for managed code. Managed mode attributes data to managed source and only collects managed portion. Native mode collects everything but does not attribute data to managed source. Mixed mode collects everything and attributes data to managed source where appropriate. |
|
Automatically resume collection after (sec) |
Specify the time that should elapse before the data collection is resumed. When this options is used, the collection starts in the paused mode automatically. |
|
Automatically stop collection after (sec) |
Set the duration of data collection in seconds starting from the target run. This is useful if you want to exclude some post-processing activities from the analysis results. |
Advanced Options
Use the Advanced section to provide more details on your target configuration.
|
Use This |
To Do This |
|---|---|
|
Custom collector |
Provide a command line for launching an external collection tool, if any. You can later import the custom collection data (time intervals and counters) in a CSV format to a VTune Amplifier result. Click the Modify button to add a path to your external collector. |
|
Analyze child processes check box |
Collect data on processes launched by the target process. Use this option when profiling an application with the script. |
|
Modify button |
Click the Modify button to open the Per-process Configuration dialog box and specify child processes to analyze. For example, if your target application calls shell or makes processes, you can choose to exclude them from analysis and focus only on the processes you develop. This option is not applicable to hardware event-based analysis types. |
|
Duration time estimate menu |
Estimate the application duration time. This value affects the size of collected data. For long running targets, sampling interval is increased to reduce the result size. For hardware event-based sampling analysis types, the VTune Amplifier uses this estimate to apply a multiplier to the configured sample after value. |
|
Allow multiple runs check box |
Enable multiple runs to achieve more precise results for hardware event-based collections. When disabled, the collector multiplexes events running a single collection, which lowers result precision. |
|
Analyze system-wide check box |
Enable analyzing all processes running on the system. When disabled, only the target process is analyzed. This option is applicable to hardware event-based sampling analysis types only. |
|
Collection data limit, MB spin box |
Limit the amount of the raw data to be collected. Use this option to start analyzing the beginning of the target execution when the amount of collected data is very large and takes long to process. Outcome: VTune Amplifier suspends data collection when the specified limit is reached.
NoteThe size of data stored in the result directory may not exactly match the specified limit due to the following reasons:
|
|
Slow frames threshold, frames/s |
Specify a threshold to separate Slow and Good frames. Frame rates lower than this threshold are marked as Slow. This threshold needs to be smaller than the Fast frames threshold. |
|
Fast frames threshold, frames/s |
Specify a threshold to separate Good and Fast frames. Frame rates higher than this threshold are marked as Fast. This threshold needs to be larger than the Slow frames threshold. |
|
CPU mask |
Specify CPU(s) to collect data on (for example: 2-8,10,12-14). This option is applicable to hardware event-based analysis types only. |
|
Trace MPI check box |
Configure collectors to trace MPI code and determine MPI rank IDs in case of a non-Intel MPI library implementation. |
|
Result location options |
Select where you want to store your result file. By default, the result is stored in the project directory. |
Example
This configuration uses the run_NPB_mic.sh script located on the card to launch a native Intel Xeon Phi coprocessor application: