When you click the
Compare Results
 button and select two results to compare, the
Summary window shows the difference between these results.
Note
You can compare any results that have common performance metrics. Intel® VTune™ Amplifier will provide comparison data for these common metrics only.
Data provided in the Summary window vary depending on the viewpoint.
Difference in the Application Performance per Metrics
In the compare mode, the first Result Summary section displays the difference in the performance metrics values between the results you specified. In the example below, the VTune Amplifier displays the difference as r001lw value - r009lw value (see the result tab title).
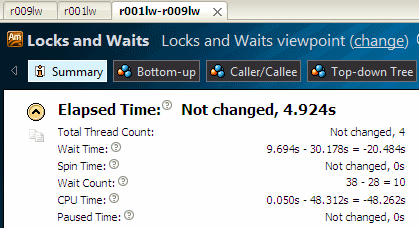
You see that the code changes in result r009lw have not changed the Elapsed time of the application in comparison with the baseline (result r001lw). But, for example, the application's CPU Time has changed significantly: result r009lw took 48 seconds more that the baseline result.
Difference in the Performance of Hotspot Objects
In the compare mode, the Top Hotspot Objects section displays the difference in performance values per object (object type depends on the viewpoint) between the results you specified. In the example below, the VTune Amplifier displays the difference as r001lw value - r009lw value (see the result tab title).
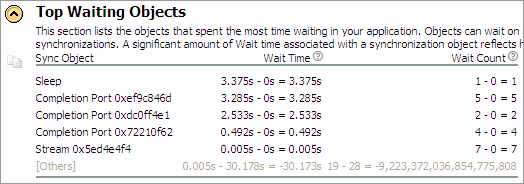
For this example, the second result r009lw did not introduce any Wait Time and Wait Count for these five top synchronization objects (zero values) but did introduce Wait Time for other synchronization objects used in the application (see the grayed-out line at the bottom).
Performance Difference in Histograms
Depending on the viewpoint, the Summary window provides the histograms that show how certain metrics, like the Thread Concurrency, CPU Usage, or Frame rate, have changed for the specified results. Bars for both results show up side by side. In the example below, the blue bars correspond to the first result, r001lw, and the brown bars correspond to the second result, r009lw. Hover over a bar to see the tooltip with the detailed information:
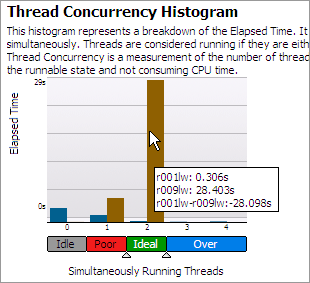
The chart shows that the Elapsed time spent within the Ideal processor utilization level has increased significantly from 0.306s (result r001lw) to 28.403s (result r009lw). This means that the optimization made in r009lw has not increased the total application Elapsed time (see the Result Summary section above) but significantly optimized the utilization of the processor cores.
Difference in Collection and Platform Info
The Collection and Platform section shows whether the result size and platform data has changed.
Note
You can click the
 Copy to Clipboard button next to any summary section and copy its content to the clipboard.