To simplify scanning the code in the Source/Assembly window and freely navigate between code lines that have the highest metric value (hotspots), use the following options:
Hotspot navigation buttons: Use these buttons on the Source/Assembly toolbar to quickly identify and switch between the hotspot code lines of the selected function.
Use the Hotspot navigation buttons as follows:
Use This
To Do This

Go to the code line that has the maximal metric value.

Go to the previous (by metric value) hotspot line.

Go to the next (by metric value) hotspot line.

Go to the code line that has the minimal metric value.
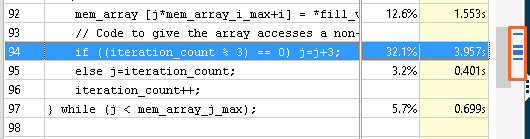
Heat map markers: Use the blue markers to the right of the vertical scroll bar to quickly identify the hotspot lines. To view a hotspot, move the scroll bar slider to the marker. The bright blue marker (
 ) indicates a hot line for the function you drilled down
into. Light blue markers (
 ) indicate
hot lines for other functions. The background color reflects the current
selection.
Note
Hotspot navigation is only available for the metric column set up as Data of Interest. For example, the default Data of Interest column for the Basic Hotspots analysis results is CPU Time. You can change this column via context menu.
Assembly grouping menu: For better navigation in the Assembly pane, you may select one of the available granularities in the Assembly grouping drop-down menu: Address, Basic Block/Address, Function Range/Basic Block/Address. VTune Amplifier updates the Assembly view grouping the instructions into collapsible nodes according to the selected hierarchy.
You may cancel the selected grouping by clicking the red cross in the Loading data message at the bottom of the window: