
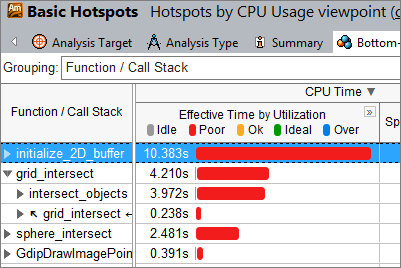
Best for analyzing call paths to find where your code is spending the most time and discover opportunities for tuning your algorithms.
Applies to C/C++, Fortran, Java*, or Python* apps and more.
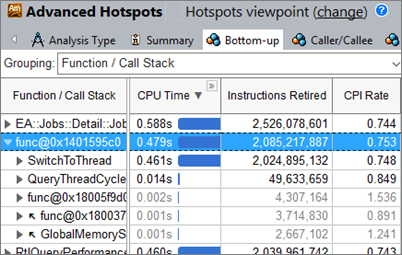
Best for analyzing an application or the entire system and getting kernel information with higher resolution from shorter sampling intervals.
Applies to C/C++, Fortran, or Java* apps and more, including apps in containers such as Docker* or LXC.
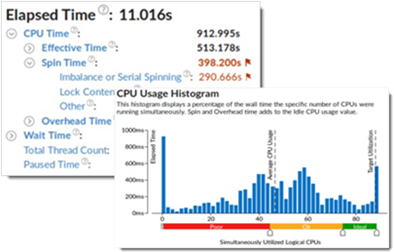
Best for visualizing thread parallelism on available cores, finding areas with high or low concurrency, and identifying serial bottlenecks in your code.
Applies to C/C++, Fortran, or Java* apps and more.
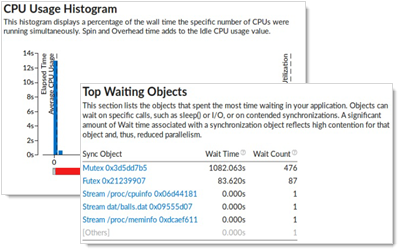
Best for locating causes of low concurrency, such as heavily used locks and large critical sections.
Applies to C/C++, Fortran, Java*, or Python* apps and more.
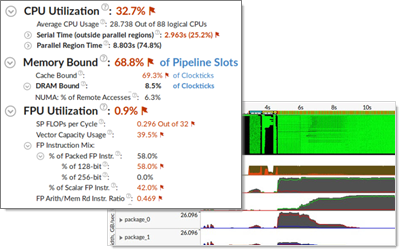
Best for understanding how your compute-intensive OpenMP* or MPI app is using the CPU, memory, and floating point unit (FPU) resources.
Applies to C/C++ or Fortran apps and more.
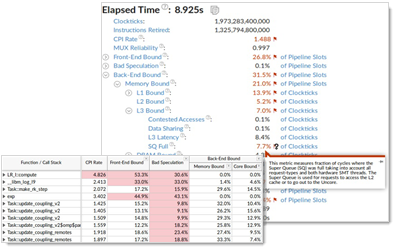
Best for identifying the CPU pipeline stage (front-end, back-end, etc.) and hardware units responsible for your hardware bottlenecks.
Applies to C/C++, Fortran, or Java* apps and more, including apps in containers such as Docker* or LXC.
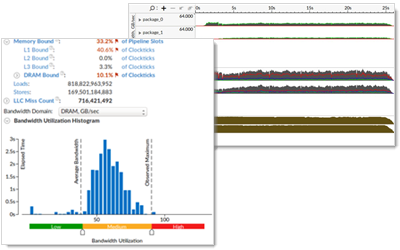
Best for memory-bound apps to determine which level of the memory hierarchy is impacting your performance by reviewing CPU cache and main memory usage, including possible NUMA issues.
Applies to C/C++, Fortran, or Java* apps and more.
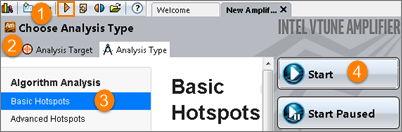
Open a project and click the New Analysis button to get started.
Intel VTune Amplifier offers other analysis types that are helpful in specific use cases.
GPU Analysis
Memory Analysis
Platform Analysis
Other analysis tools are available as part of the Intel Parallel Studio or Intel System Studio.
The Intel Developer Zone website offers more information about Intel VTune Amplifier features and usage.