The hotspot display varies depending on the grouping level or granularity. The available groups depend on the analysis type and viewpoint. For example, Module/Code Location is the smallest hotspot granularity for hardware event-based sampling data. It shows hotspots by relative virtual address.
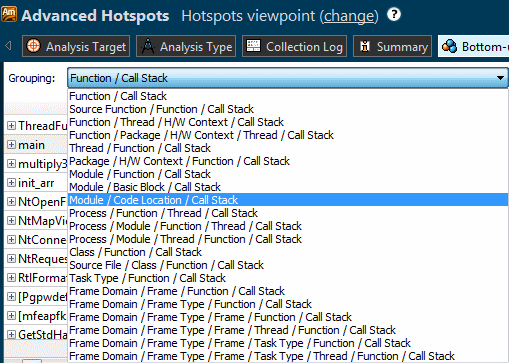
For most viewpoints, function level is the default. If application modules have debug information, you can rely on functions shown as hotspots. When debug information is incomplete or missing, you may see a number of <unknown> functions, or samples collected on internal functions of a module might be attributed to adjacent exported functions.
VTune Amplifier provides the following grouping options:
|
To Do This |
Do This |
|---|---|
|
Change the hierarchy of the data displayed in the Bottom-up pane to identify hotspots |
Use the Grouping drop-down menu on top of the grid and select the required grouping level. NoteThe Top-down Tree pane is always grouped by function. |
|
Change the hierarchy of the instructions in the Assembly pane |
Select the required granularity from the Assembly grouping drop-down menu on the Source/Assembly window toolbar. |
|
Change the hierarchy of the data displayed in the Timeline pane |
Use the drop-down menu in the Legend area to group the data by selected program units. The selected grouping level affects the list of performance metrics displayed in the Timeline view. |
|
Create a custom grouping |
Click the |
|
View the next level of grouping |
Click the
|
|
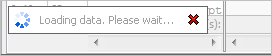
Cancel the selected grouping |
Click the red cross in the Loading data message at the bottom of the window.
|
|
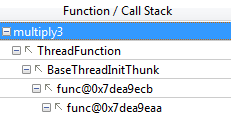
Change the stack layout for the Call Stack grouping level |
Click the
Chain layouts
While tree layouts
NoteChain layouts in the Top-down Tree pane is possible only if there is no branching AND when all values of data columns are the same for the parent and for the child. |
 Customize Grouping button to open the
 button.
 Change Stack Layout button to switch between call stack layouts.

 are more natural for the top-down view: