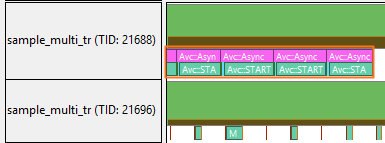
Intel® VTune™ Amplifier can help you analyze the performance of particular code regions (tasks) if your target uses the Task API to mark task regions and you enabled the Analyze user task option during the analysis type configuration.
To interpret the data provided during the user task analysis, you may follow the steps below:
Identify Most Critical Tasks
Start exploring the collected data with the Hotspots by CPU Usage viewpoint. The Summary window provides a list of five most critical tasks that took most of the time to execute.
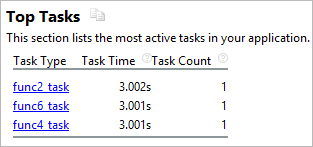
Click a task type in the table to switch to the Bottom-up view and analyze all task-related performance metrics.
The Bottom-up view is automatically grouped by the Task Type granularity and highlights the task selected in the Summary window:
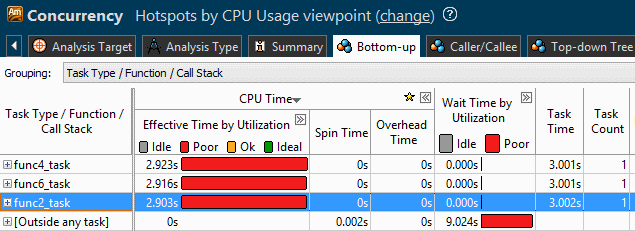
In the example above, the func2_task task has the longest duration - 3.002 seconds.
Analyze Tasks per Threads
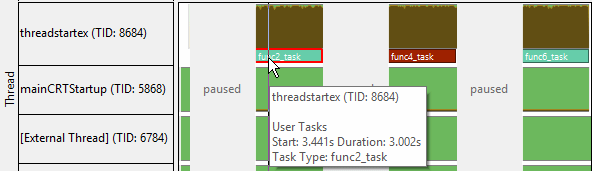
To analyze a duration of each task instance, explore the Timeline view:
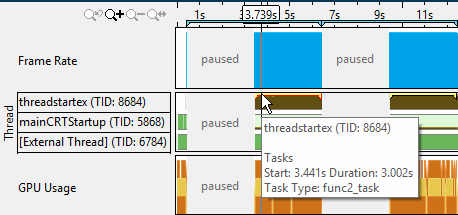
User tasks are shown on the timeline with yellow markers. Hover over a task marker for task execution details. In the example above the func2_task started at the 3.4th second of the application execution on the thread threadstartex (TID: 8684) and lasted for 3.002 seconds.
If you collected platform-wide metrics, you may switch to the Platform window and identify threads responsible for particular tasks. Each task shows up on the thread row as a separate layer.
If several tasks were executed on a thread in parallel, a stack of tasks will be displayed: