Note
This type of analysis is supported by the VTune Amplifier XE only.
If you identified with the Intel® VTune™ Amplifier that your application is GPU-bound and you know that your application uses OpenCL™ software technology, you may enable the Trace OpenCL and Intel Media SDK programs (Intel HD Graphics only) configuration option for your analysis to identify how effectively your application uses OpenCL kernels. Follow these steps to explore the data provided by the VTune Amplifier for OpenCL application analysis:
Explore Summary Statistics
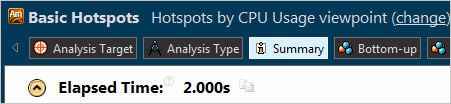
Start your data analysis with the Summary window that provides application-level performance statistics. Typically, you focus on the primary baseline, which is the Elapsed Time metric that shows the total time your target ran:
You can correlate this data with the GPU Time used by GPU engines while your application was running:
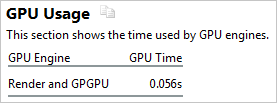
If the GPU Time takes a significant portion of the Elapsed Time, it clearly indicates that the application is GPU-bound. In the example above, the GPU Time spent in the Render and GPGPU engine is very small, which means that most of the time your application was using CPU resources.
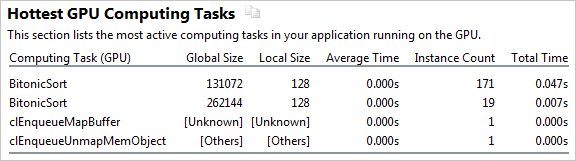
For OpenCL applications, the VTune Amplifier provides the list of OpenCL kernels with the highest execution time:
The Summary window also displays platform information including GPU and CPU data. For example, for the Windows target:
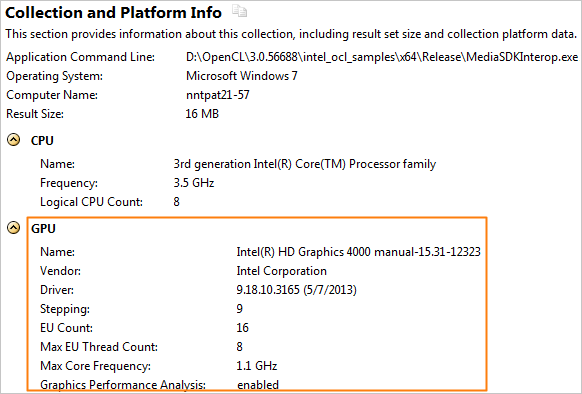
The last four GPU characteristics are specific to Intel® HD Graphics.
Identify Hot GPU OpenCL Kernels
To view information about all OpenCL kernels running on the GPU, in the Graphics window switch Grouping to Computing Task Purpose / Computing Task (GPU) / Instance. VTune Amplifier identifies the following computing task purposes: Compute (kernels), Transfer (OpenCL routines responsible for transferring data from the host to a GPU), and Synchronization (for example, clEnqueueBarrierWithWaitList).
The corresponding columns show the overall time a kernel ran on the GPU and the average time for a single invocation (corresponding to one call of clEnqueueNDRangeKernel ), working group sizes, as well as averaged GPU hardware metrics collected for a kernel. Hover over a metric column header to read the metric description and view the formula used for the metric calculation. If a metric value for a computing task exceeds a threshold set up by Intel architects for the metric, this value is highlighted in pink, which signals a performance issue. Hover over such a value to read the issue description.
Every clCreateKernel results in a line in the Compute category. If two different kernels with the same name (even from the same source) were created with two clCreateKernel calls (and then invoked through two or more clEnqueueNDRangeKernel ), two lines with the same kernel name appear in the table.
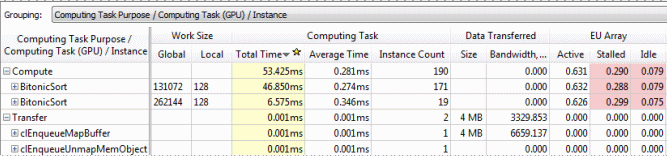
Source Computing Task (GPU) grouping is useful to aggregate data per the same kernel source:

Analyze and optimize hot kernels with the longest Total Time values first. These include kernels characterized by long average time values and kernels whose average time values are not long, but they are invoked more frequently than the others. Both groups deserve attention.
Correlate OpenCL Kernels Data with GPU Metrics
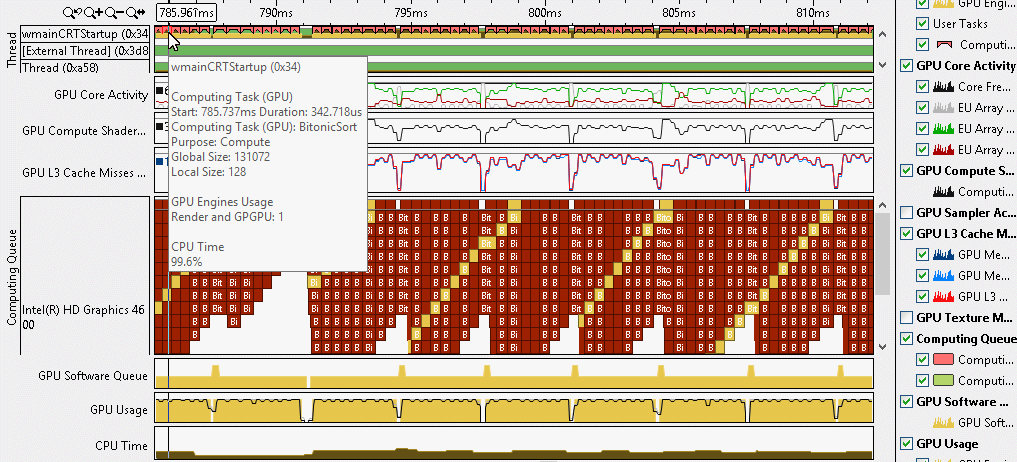
Explore the Timeline pane> Metrics Over Time tab to analyze OpenCL kernels execution over time.
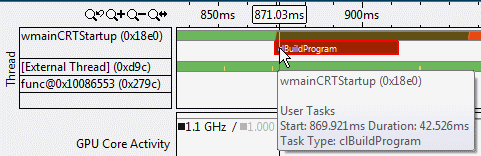
OpenCL APIs (for example, clBuildProgram) show up on the Thread area as tasks:
To correlate GPU metrics and OpenCL kernels data, explore the Timeline pane :
Note
For Linux targets, the collection of GPU hardware metrics is not supported.
You may find it easier to analyze your OpenCL application by exploring the GPU hardware metrics per GPU architecture blocks. To do this, choose the Computing Task grouping level in the Graphics window, select an OpenCL kernel of interest and click the Architecture Diagram tab in the Timeline pane. VTune Amplifier updates the architecture diagram for your platform with performance data per GPU hardware metrics for the time range the selected kernel was executed.
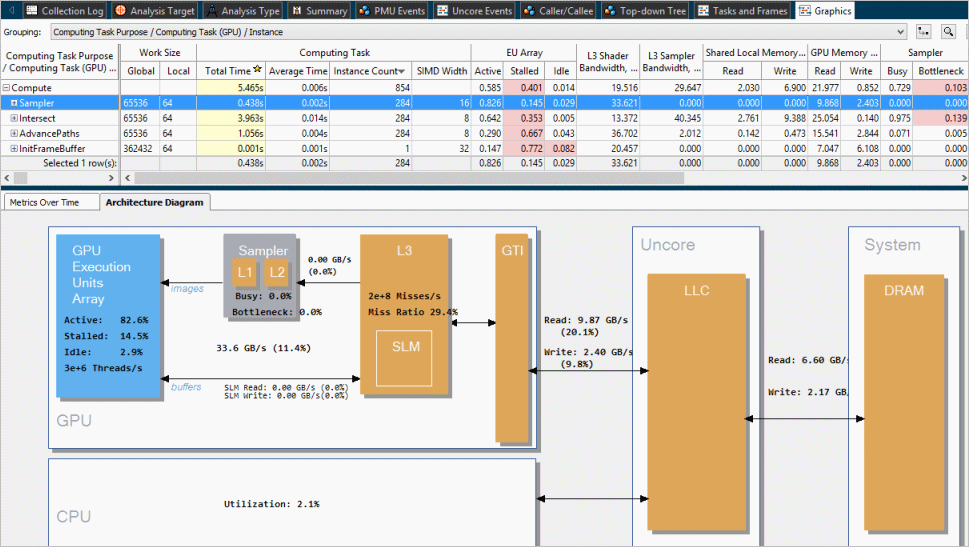
Currently this feature is available for the 4th generation Intel® Core™ processors and the Intel® Core™ M processor, with a wider scope of metrics presented for the latter one.
Explore the Computing Queue
To view details on OpenCL kernels submission, in particular distinguish the order of submission and execution, and analyze the time spent in the queue, zoom in and explore the Computing Queue data in the Timeline pane. You can click a kernel task to highlight the whole queue to the execution displayed at the top layer. Kernels with the same name and size show up in the same color.
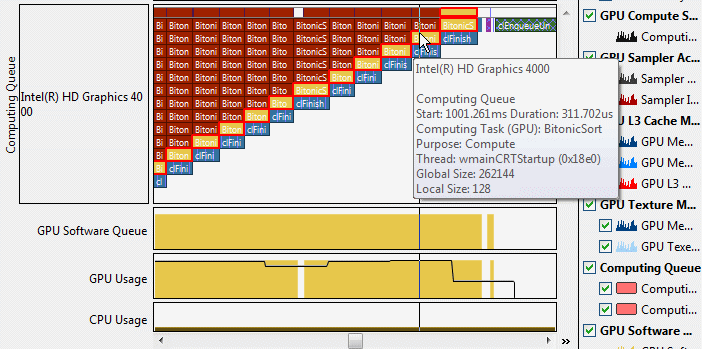
VTune Amplifier displays kernels with the same name and size in the same color. Synchronization tasks are marked with vertical hatching
 . Data transfers, OpenCL routines responsible for transferring data from the host system to a GPU, are marked with cross-diagonal hatching
 .